![How to Create a Social Media Report in 7 Simple Steps [+ Free Templates]](https://ea317a72.delivery.rocketcdn.me/wp-content/uploads/2025/04/How-to-Create-a-Social-Media-Report-in-7-Simple-Steps-Free-Templates.jpg)
How to Create a Social Media Report in 7 Simple Steps [+ Free Templates]
Social media is one of the most powerful marketing channels for businesses today. It consistently delivers high ROI across industries, making it a key tool for growth.
But proving that value to decision-makers? That’s where a social media report comes in.
A well-crafted social media analytics not only measures success but also provides actionable insights for future strategies. It helps your team evaluate performance, track progress toward goals, and showcase results effectively.
So, how do you create a social media report that delivers real impact? Let’s break it down into seven simple steps, along with free social media report templates to help you get started faster.
What is a Social Media Report?
A social media report is a structured summary of how your social media platforms are performing. It goes beyond basic social media analytics like followers, click-through rates, likes, and shares—instead, it focuses on key trends, insights, and goal tracking.
Unlike real-time social media dashboards, which monitor daily activities, a social media report provides a big-picture analysis that helps teams refine strategies and prove success to stakeholders.
This report can be generated weekly, monthly, quarterly, or annually, depending on the depth of analysis required. It also helps identify which campaigns are working and which need improvement.
Types of Social Media Reports
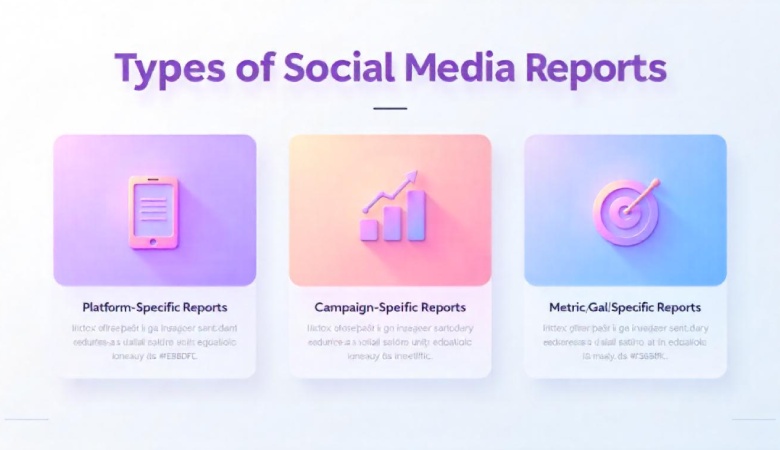
1. Platform-Specific Reports
Each social media analytics has its own unique audience and engagement patterns. A platform-specific report focuses on one channel at a time—like Instagram, Facebook, or YouTube—to provide in-depth performance analysis.
For instance, an Instagram report may highlight engagement trends on Reels, while a LinkedIn report might focus on post reach and professional interactions. This helps teams refine content strategies per platform.
2. Campaign-Specific Reports
Did you launch a new product, seasonal campaign, or lead-generation offer? A campaign-specific report evaluates how different social media platforms contributed to the campaign’s success.
These reports help measure whether a campaign met its objectives, whether through organic reach, paid ads, or influencer collaborations. If performance falls short, teams can adjust strategies for future campaigns.
3. Metric/Goal-Specific Reports
If your primary goal is to increase website traffic, generate leads, or drive conversions, a goal-specific report will track your progress.
For example, if your objective is to boost brand awareness, your report should focus on follower growth, impressions, and reach metrics. If engagement is the goal, measuring comments, shares, and time spent on posts is key.
Why Use Social Media Reporting?

This report for your social does more than track numbers—it aligns marketing efforts with business goals. Here’s why it’s essential:
- Provides transparency – Helps teams and stakeholders understand the impact of social analytics performance.
- Encourages alignment – Ensures that marketing, sales, and customer service teams are on the same page.
- Tracks progress – Highlights whether your social media strategy is working or needs adjustments.
A well-structured report ensures that teams don’t just look at vanity metrics but instead focus on the data that influences decision-making. By tracking consistent trends, businesses can optimize strategies in real-time.
HubSpot offers a free social media report template that simplifies reporting. Just plug in your social media metrics and customize it to fit your organization’s needs.
What Should Your Social Media Analytics Include?
A strong social media report typically covers these four key areas:
1. Report Overview
This is your executive summary—a high-level breakdown of key findings, trends, and major takeaways. It’s especially useful for busy stakeholders who may not have time to dive into full analytics.
A well-written overview should answer key questions: What worked well? What didn’t? What’s the next step? This section should be brief but impactful.
2. Goals & Initiatives
Clarify your social media KPIs and business objectives. Are you aiming to increase engagement, grow followers, or drive website traffic? Stating your goals provides context for the data.
By defining clear goals, you ensure that the report stays focused on relevant metrics instead of overwhelming readers with unnecessary data points.
3. Metrics Analysis
Instead of listing numbers, analyze what they mean. Are engagement rates improving? Which posts performed best? Highlight key trends in social media performance to guide future strategies.
Comparing previous reports with current data helps track progress and identify areas for improvement. For instance, if engagement has dropped, was it due to content type, timing, or audience behavior shifts?
4. Key Takeaways & Recommendations
Summarize insights, challenges, and next steps. If engagement is declining, suggest changes like adjusting post frequency or testing new content formats.
Recommendations should be specific and actionable. Instead of saying, “Increase engagement,” suggest, “Post more short-form videos and use trending audio to boost interaction.”
What Social Media Metrics Should You Include?

Not all social media metrics are equally important. The right ones depend on your platforms, goals, and audience behavior. Here are some key metrics to track:
1. Audience Size & Growth (Followers)
This metric shows how many people follow your brand and how quickly your audience is growing.
Tracking follower growth over time helps determine the effectiveness of campaigns and content strategies. Sudden spikes or drops can indicate shifts in brand perception or algorithm changes.
2. Post Frequency
How often are you posting? Comparing post frequency with engagement rates helps determine the optimal posting schedule.
Posting too often may overwhelm your audience while posting too little can reduce visibility. Finding the right balance is crucial.
3. Engagement Rate
Likes, shares, comments, and interactions measure how engaging your content is. A high engagement rate suggests strong audience interest.
Analyzing which content types generate higher engagement (e.g., videos vs. images) helps refine content strategies for better results.
4. Click-Through Rate (CTR)
This metric measures how many users click on links in your posts, showing how effective your social media content is at driving traffic.
Higher CTRs often indicate strong calls-to-action (CTAs) or highly relevant content that compels users to take action.
5. Conversions & Lead Generation
If you’re using social media to generate leads, subscribers, or sales, track conversion rates to measure effectiveness.
By identifying which platforms and campaigns drive the most conversions, businesses can optimize ad spend and content direction.
6. Conversions & New Contacts
Conversions come into play if you‘re using social media to generate leads, subscribers, or even customers.
If you want to attribute contacts to your social media team’s efforts, make sure you‘re using proper tracking and setting reasonable goals, as it’s rare in some industries to go straight from social media to becoming a customer.
Tip: Use UTM parameters and CRM integration to clearly connect social efforts to leads and sales. This will help you prove impact with actual numbers rather than assumptions.
7. Return on Investment (ROI)
Directly tracing ROI to social media efforts can be tricky. However, if you determine it’s worth reporting on this metric, ensure you have established proper expectations and attribution models.
Tip: Use assisted conversion data from platforms like Google Analytics or HubSpot to understand the indirect role social media plays in nurturing leads before they convert elsewhere.
8. Cost per Mile (CPM) / Cost per Click (CPC)
This metric is essential for monitoring the performance of your social media ads. Similar to ROI, it helps you evaluate how much you’re spending in relation to what you’re getting. You can ignore this if you’re solely reporting on organic social metrics.
Tip: Always compare your CPM and CPC to industry benchmarks to assess if your ads are underperforming or exceeding expectations. This helps you make smarter budgeting decisions.
9. Competitor Metrics
To provide a benchmark, consider analyzing the aforementioned metrics for your competitors.
Obviously, these metrics can vary drastically based on publicity, paid budget, and the size of the company, but it’s still worthwhile to make the comparison.
Tip: Tools like Sprout Social or Hootsuite can automate competitor benchmarking, saving you time and providing consistent insights over time.
How to Create a Social Media Report
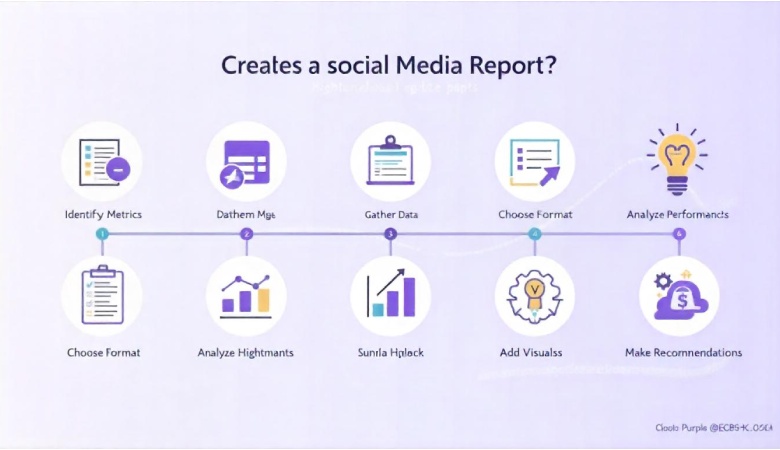
Step 1: Identify your social media metrics
Different companies and different social media teams value different social media metrics. It’s your job to choose the metrics that matter most to your team and your organization.
Keeping in mind the list from above, the specific social media platforms you use, and your goals, narrow down the metrics you need to present to your team.
For instance, if you’re focused on building brand awareness, you’ll want to highlight follower numbers and views. If your goal is website traffic, you’ll want to look at clicks.
Tip: When I’m unsure of what to include or my report feels a little incomplete, I ask my peers which metrics they’d like to see or which ones they need clarification on. Making these changes sooner rather than later helps keep your team informed and engaged.
Step 2: Gather your data
Once you know what you‘re reporting on, it’s time to start collecting data.
When setting up your social media reports, create bookmarks for your data sources. Make a folder for the analytics page for each social media channel you’re analyzing and/or your social media reporting software for an all-encompassing view.
If you‘re tracking click-throughs to your website, make sure you’re analyzing from a single master location, such as your tracking URL builder or your traffic tracking tool like HubSpot or Google Analytics.
Tip: Always double-check the date ranges when pulling data from multiple platforms to ensure consistency across your entire report.
Step 3. Choose your report format
Think about who your audience is and how they best consume information.
Perhaps that’s a social media report presentation, spreadsheet, or memo template. Perhaps it’s a combination of a few formats, along with a video walk-through.
Tip: Whatever you choose, stick with it. A consistent format brings familiarity, making comparing and understanding future updates easier. Plus, when you maintain your format, you can just copy over your most up-to-date metrics rather than reinventing the wheel every time.
Optional: Choose your social media report template
If you’re just getting started, we suggest using a social media report template to make your life easier. For instance, a PowerPoint or Google Slide Deck template can be shared with your team via email, used for in-person meetings/presentations, or both.
Need a social media report template to get started? We’ll share a few options later, but you can’t go wrong with ours.
Step 4: Analyze performance
With all of your data in place, it’s time to analyze.
What metrics went up or down? What posts did well or not so well? What does this say about your performance? How about the progress toward your goals?
Use this time to really dig in and see what your metrics are telling you.
Tip: AI has helped me a lot in this area. Check out our free guide, “How to Use AI for Data Analysis,” to make performance analysis faster and more insightful.
Step 5: Summarize highlights and add context
Next, summarize the key findings and highlights from your analysis. Don’t just think quantitatively here; think qualitatively.
Maybe a major celebrity commented on content for the first time, or you saw a record number of shares. Make sure to capture these in your report as well.
Also, add context to help your audience better understand the story you are telling.
A social media report should always remind people where you came from and where you plan to go. That means addressing how your numbers have changed since the last period of time you presented, in addition to why they changed.
Tip: Consider adding a simple SWOT analysis (Strengths, Weaknesses, Opportunities, Threats) at the end of this section to provide a clear picture of what’s working and what needs attention.
Step 6: Add Visuals
A chart of numbers on a slide deck is, well, pretty boring.
While a numerical chart is important for sharing as much info as possible in an organized way, using visuals is a better way to convey the growth and success metrics of your social media performance.
Try incorporating one or all of the following into your social media reports:
- Linear graphs to show followers over time.
- Pie charts to show clicks to different pages of your website (blog pages vs. case studies, for example).
- Bar graphs to show the number of engagements on each platform.
- Typography highlighting key trends or findings
- Screenshots of top or low-performing posts
Tip: Tools like Canva or PowerPoint’s built-in visualization tools can help you create professional visuals, even if you’re not a designer.
Step 7: Make Recommendations
Each report should contain clear action items about how you plan to continuously improve your social media performance.
Social media is constantly evolving, so your approach and strategy for it should, too.
Tip: Use the SMART framework (Specific, Measurable, Achievable, Relevant, Time-bound) to make sure your recommendations are practical and easy to implement.
Part 3: Social Media Report Templates & Examples
1. Hootsuite
Hootsuite offers a structured social media report template that simplifies tracking performance across platforms. It comes in an editable Google Slides format, which you can copy and customize to fit your brand’s identity. Unlike Later’s playful design, Hootsuite’s template is more versatile and professional, making it suitable for various business types.
What I like: This template includes built-in instructions, making it easy to fill out step by step. It also has dedicated slides for major social platforms, showcasing essential data such as clicks, likes, top-performing posts, and platform-specific metrics like retweets. This ensures a well-rounded report that provides actionable insights.
2. The CMO Club
The CMO Club’s template is designed for data-driven reporting, catering specifically to executive-level audiences. Unlike others, this template is an editable Google Sheet rather than a slide deck. It prioritizes numerical insights over visuals, making it ideal for decision-makers who need detailed analytics rather than design-heavy presentations.
What I like: This template gets incredibly granular with its structure, featuring separate tabs for:
- Objectives & Benchmarks – Defines what success looks like for your brand.
- Audience Insights – Analyze your followers’ demographics and behavior.
- Metrics & KPIs – Tracks key performance indicators like engagement rates and reach.
- Platform & Content Analysis – Compares post types and performance trends.
Even though it’s more analytical, it still ends with recommendations and takeaways to guide future strategies.
Pro tip: If you want a visually engaging report, consider using Canva or Adobe templates for a more polished and brand-aligned presentation.
Social Media Report Examples
Since most social media reports are confidential, finding real-world examples can be challenging. However, here are some public reports that showcase how brands measure success:
1. Top-Performing Posts
Later, it provides an insightful example of a top-performing post slide in their blog. It not only displays the posts with the highest engagement but also explains why they performed well. This approach helps social teams understand what resonates most with their audience and refine their content strategy accordingly.
2. Profile Traffic
Keyhole analyzed Coca-Cola’s profile traffic over a year, showcasing how audience behavior fluctuates. This kind of reporting is useful for spotting seasonal trends, identifying growth
patterns, and evaluating long-term engagement.
3. Follower Growth
Tracking follower growth over time can be an effective way to measure brand awareness. For example, Coca-Cola’s growth chart highlights the success of its campaigns, making it easy to visualize continuous improvements in audience reach.
4. Post Type Performance
An analysis of Coca-Cola’s content strategy revealed how often different types of posts were shared versus their actual performance. Seeing these charts side-by-side helps brands align their posting frequency with audience preferences. Color-coded visuals further enhance readability and decision-making.
5. Social Traffic Breakdown
Walmart’s social traffic report from 2023 provided insights into how different platforms contributed to overall engagement. Their data showed YouTube as the top performer, followed by Reddit and Facebook. This information is valuable for budget allocation—if organic traffic is strong on one platform, investing in paid ads there may yield higher returns.
Key takeaway: Each report example follows a similar structure, helping businesses track growth trends, understand platform-specific performance, and optimize their social strategy accordingly.
Partner with our Digital Marketing Agency
Ask Engage Coders to create a comprehensive and inclusive digital marketing plan that takes your business to new heights.
(Social Media) Reporting for Duty in 2025

A well-crafted social media report is more than just numbers—it tells a story about your brand’s progress, challenges, and opportunities. By using structured templates, analyzing key trends, and presenting actionable insights, your report becomes a powerful tool for strategic decision-making. Whether you’re tracking organic reach, paid ads performance, or engagement trends, thoughtful reporting ensures you stay ahead in the ever-evolving social media landscape.
Now that you’ve got the right tools and templates, it’s time to put your social media insights into action!