Market Success: How to Build and Leverage a Competitive Matrix for Strategic Growth
What Is a Competitive Matrix?
A competitive matrix is a tool designed to help businesses visually compare their performance against competitors, offering insights into how they measure up in the market. Structured as a grid or table, it lists brands and key competitors along one axis while highlighting critical market factors on the other.
There are various types of competitive matrices, each presenting data in distinct formats. For example, the Growth Quadrant from Semrush is a competitor matrix that can be generated using the Market Explorer tool. This quadrant-based visualization divides competitors into four categories:
- Game Changers
- Leaders
- Niche Players
- Established Players
We’ll explore these categories further and guide you through creating this matrix using your competitors’ data. First, let’s examine why leveraging a competitive matrix is essential for success.
Table of Content
Why Is Using a Competitive Matrix Important?
A competitor analysis matrix provides valuable insights that empower businesses to gain a competitive edge. Its primary function is to show where your company stands relative to competitors, offering clarity on both strengths and weaknesses. These insights enable teams to:
- Strategically position their brand by identifying ways to differentiate themselves and fill gaps in the market.
- Make informed decisions about product development, marketing strategies, and resource allocation based on a clear understanding of the competitive landscape.
- Predict competitor moves by analyzing their strengths and weaknesses, helping to stay ahead of industry trends.
In summary, a well-researched competitive analysis matrix equips businesses with actionable insights to navigate fierce competition confidently—even in markets where products may appear identical.
5 Competitor Matrix Types with Examples and Templates
Various types of competitive matrices cater to different analytical needs. Depending on your goals, you can select one or more frameworks to conduct effective competitor benchmarking. Let’s review some of the most commonly used types.
Competitive Comparison Grid
A competitive comparison grid, also referred to as a competitive positioning matrix, offers a framework for visualizing how customers perceive your company relative to competitors. It evaluates factors such as price, quality, service, and innovation to clarify market positioning. Typically, it uses two axes representing key success metrics.
For instance, one axis might represent “Market Presence,” calculated using G2’s scoring methodology, which aggregates data from multiple sources. The other axis could signify “Satisfaction,” derived from user reviews. Based on these scores, companies are categorized into four quadrants:
- Leaders: High user satisfaction and high market presence
- Contenders: High user satisfaction but low market presence
- High Performers: Low user satisfaction but high market presence
- Niche: Low user satisfaction and low market presence
You can achieve a similar visualization of the digital competitive landscape using Semrush’s Growth Quadrant matrix. To access it, open the Market Explorer tool, click the “Find Competitors” tab, enter your location and domain name, and hit the “Research a market” button. Scroll down to the “Growth Quadrant” widget, where you’ll see your website’s positioning compared to competing sites.
The Growth Quadrant categorizes websites based on metrics like:
- Leaders: High-traffic sites with high growth rates
- Established Players: High-traffic sites with low growth rates
- Game Changers: Low-traffic sites with high growth rates
- Niche Players: Low-traffic sites with low growth rates
You can customize the metrics by selecting options from the drop-down menus next to the X-axis and Y-axis and clicking “Apply.” This will reveal where you—and your main competitors—stand based on selected metrics. Use these insights to identify areas where competitors excel and refine your growth strategy accordingly.
Competitor Comparison Chart
A competitor comparison chart, also referred to as a competitive landscape chart, is typically presented as a table that compares your products, services, or strategies against those of your competitors. For example:
Sample competitive comparison chart to evaluate a business alongside competitors
This type of competitor matrix is particularly valuable for conducting a broad competitive analysis. The side-by-side format provides quick insights into key areas such as:
- The strengths and weaknesses of competitors’ go-to-market strategies
- Competitors’ relative presence across specific marketing channels
- Competitors’ most successful customer acquisition channels
You can use the competitive comparison chart template (available in the second tab) to create your own. Additionally, these charts can be adapted for narrower analyses, such as comparing specific products or features.
Such focused analyses can be beneficial for:
- Product or service development: Identifying gaps in the current market, improving offerings, and establishing strong differentiators.
- Marketing and sales: Refining messaging to emphasize your unique value proposition.
- Strategic decision-making: Guiding decisions about pricing models, feature development, partnerships, and acquisitions.
Alternatively, you can focus your analysis on a handful of areas most relevant to your business. Use the competitive landscape chart template (found in the sixth tab) and customize the fields to suit your needs.
Gartner’s Magic Quadrant
Gartner’s Magic Quadrant evaluates how brands perform in a specific technology market. It assesses their ability to understand and shape the future of the market, as well as their execution in critical areas such as market share, product capabilities, sales channels, and customer experience.
Based on these factors, companies are categorized into one of four quadrants:
- Leaders: Established brands with strong execution capabilities and a clear vision for the market’s future.
- Challengers: Brands with sufficient resources and execution strength but lacking a forward-thinking vision.
- Visionaries: Players with innovative ideas and intellectual properties but weaker execution capabilities.
- Niche Players: Brands that cater to specific market segments or offer limited product portfolios.
For instance, Gartner’s Magic Quadrant for DevOps Platforms provides data that can inform strategic decisions. Suppose your brand falls into the “Visionaries” quadrant—indicating a disruptive idea but limited execution resources. This insight highlights where to focus efforts, such as partnering with a business in the “Challengers” quadrant, which may lack vision but has execution capabilities.
Keep in mind that the Gartner Magic Quadrant Matrix is a snapshot and not an absolute ranking.
SWOT Analysis
A SWOT analysis (Strengths, Weaknesses, Opportunities, Threats) competitor matrix evaluates a company’s internal strengths and weaknesses, as well as external opportunities and threats. This framework helps teams:
- Identify and leverage strengths (e.g., strong brand awareness) to outperform competitors.
- Address weaknesses (e.g., poor customer service) before they become liabilities.
- Spot and capitalize on emerging opportunities (e.g., new market segments).
- Anticipate and mitigate potential threats (e.g., political instability).
Here are some questions to guide your SWOT analysis:
strategies!
SWOT Analysis Table
| STRENGTHS | WEAKNESSES |
|---|---|
| – Ethically sourced, high-quality, organic beans | – Limited brand recognition in a crowded market |
| – Unique flavor profiles | – Higher price point compared to non-organic competitors |
| – Beans sourced from various regions | – Lack of physical retail presence |
| – Commitment to sustainability and eco-friendly packaging | – Inadequate supply chain for specialty beans |
| – Strong online presence | |
| – Passionate and knowledgeable team |
| OPPORTUNITIES | THREATS |
|---|---|
| – Growing consumer demand for organic products | – Established organic coffee brands with larger marketing budgets |
| – Increased awareness of health benefits associated with organic food | – Fluctuations in coffee bean prices |
| – Expanding online marketplace for specialty goods | – Entry of large, non-organic brands into the organic market |
| – Partnerships with cafes and stores aligned with brand values | – Changes in consumer preferences or economic downturns |
| – Rising popularity of subscription models |
Competitive Profile Matrix
A competitive profile matrix allows you to benchmark your offering directly against major competitors, providing a detailed view of how you compare overall. It achieves this by rating competitors on critical success factors (CSFs) using a weighted scoring method.
Here’s how the process works:
- Identify three to four key competitors you wish to evaluate.
- Determine your CSFs—these are the critical areas that drive success in your market, such as product or service quality, pricing, customer support, distribution network, or innovation.
- Assign weights to each CSF, ranging from 0.0 (low importance) to 1.0 (high importance). Ensure the total weight adds up to 1.0.
- Rate each competitor across all CSFs on a scale of 1-4 or 1-5, where a higher rating indicates stronger performance for that factor.
- Multiply the weight by the competitor’s rating for each CSF to calculate a score. Sum up the individual CSF scores for each competitor to determine their total weighted score.
This structured approach helps prioritize areas of strength and weakness, enabling more informed strategic decisions. Below is an example table to illustrate the process:
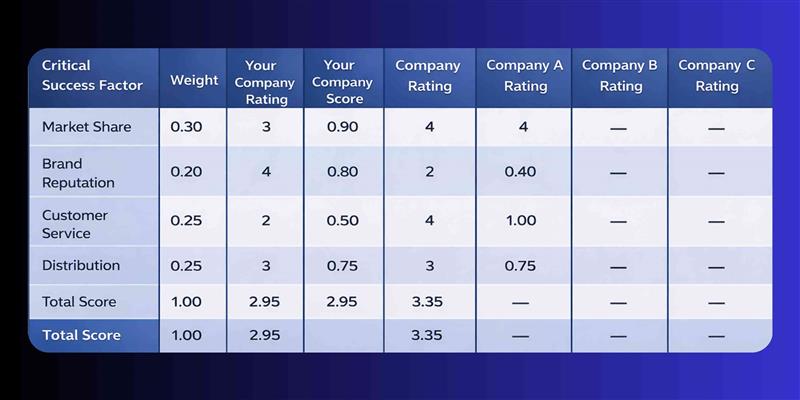
How to Interpret the Competitive Profile Matrix Table
The company with the highest total weighted score is generally considered the strongest competitor in the market. Carefully examine your ranking in each Critical Success Factor (CSF) relative to others. Identify areas where you lag behind and where you excel. Use these insights to refine your strategy, focusing on improving weaker areas while leveraging your strengths to maintain a competitive edge.
How to Create Your Own Competitive Matrix
Step 1. Identify Your Competitors
List 3-5 key competitors, including direct and indirect players in your industry. Prioritize those with significant market influence or similar target audiences.
Step 2. Determine Comparison Factors
Select 5-10 critical success factors (CSFs) such as pricing, product quality, customer support, innovation, or distribution. These factors should align with your business goals and market demands.
Step 3. Gather Data
Collect relevant data for each competitor:
- Website Traffic Data: Tools like Semrush or Ahrefs can provide insights into traffic volume and sources.
- Social Media Data: Analyze engagement metrics, follower counts, and content strategies.
- Demographic, Geographic, and Socioeconomic Data: Understand audience profiles and market segmentation.
Step 4. Fill In the Matrix
Populate your matrix with ratings and weights for each CSF. Calculate scores to compare performance objectively. Use the results to guide strategic decisions and enhance your competitive positioning.
Use Your Findings to Gain a Competitive Advantage
The primary objective of creating a competitive matrix is to transform raw data into actionable insights that can fuel business growth. By understanding where you stand in relation to competitors, you can make informed decisions to enhance your market position.
Partner with our Digital Marketing Agency
Ask Engage Coders to create a comprehensive and inclusive digital marketing plan that takes your business to new heights.
Contact Us
However, sustaining a long-term competitive edge demands continuous awareness of your competitors’ activities. Regularly monitor their newly published pages, blog posts, Google Ads campaigns, social media updates, and other strategic moves. This ongoing vigilance ensures you stay ahead of industry trends and adapt swiftly to changes, enabling you to anticipate shifts and maintain your advantage in the marketplace.
FAQs
A competitive matrix meaning revolves around a visual tool that compares your business against rivals. It helps identify market gaps and opportunities for strategic growth.
It clarifies where your brand stands relative to competitors, aiding in differentiation. A well-defined market positioning matrix ensures your unique value proposition reaches the right audience.
Common types include the Competitive Comparison Grid, Gartner’s Magic Quadrant, and SWOT analysis tables. These frameworks help visualize data for better strategic decision-making.
First, identify key competitors and select critical success factors like pricing or quality. Then, gather data and populate the grid to visualize your market standing.
Include metrics like market share, customer satisfaction, pricing, and product features. These factors are essential for accurate competitive benchmarking methods and analysis.
Assign weights to critical success factors and rate competitors on a scale. Multiply the weight by the rating to get a weighted score that reveals the strongest market player.
Use SWOT competitor analysis when you need to evaluate internal strengths against external threats. It is perfect for identifying risks and capitalizing on new market opportunities.
It highlights competitor weaknesses and industry trends you can leverage for success. Applying competitive benchmarking methods allows for data-driven adjustments to your business plan.
Top competitor analysis tools include Semrush, Ahrefs, and G2 for traffic and sentiment data. These platforms provide the raw intelligence needed to build accurate matrices.
Regularly monitor their blog posts, social media campaigns, and customer reviews. Continuous tracking helps you anticipate moves and maintain a competitive edge.